How to Capture Errors from the Javascript Console in Chrome

Updated on January 11th, 2024

  1. Open the Developer Tools by clicking the three-dotted icon at the top right of Chrome, mousing over More Tools, and selecting Developer Tools. Then, select the Console tab at the top of the Developer Tools window.
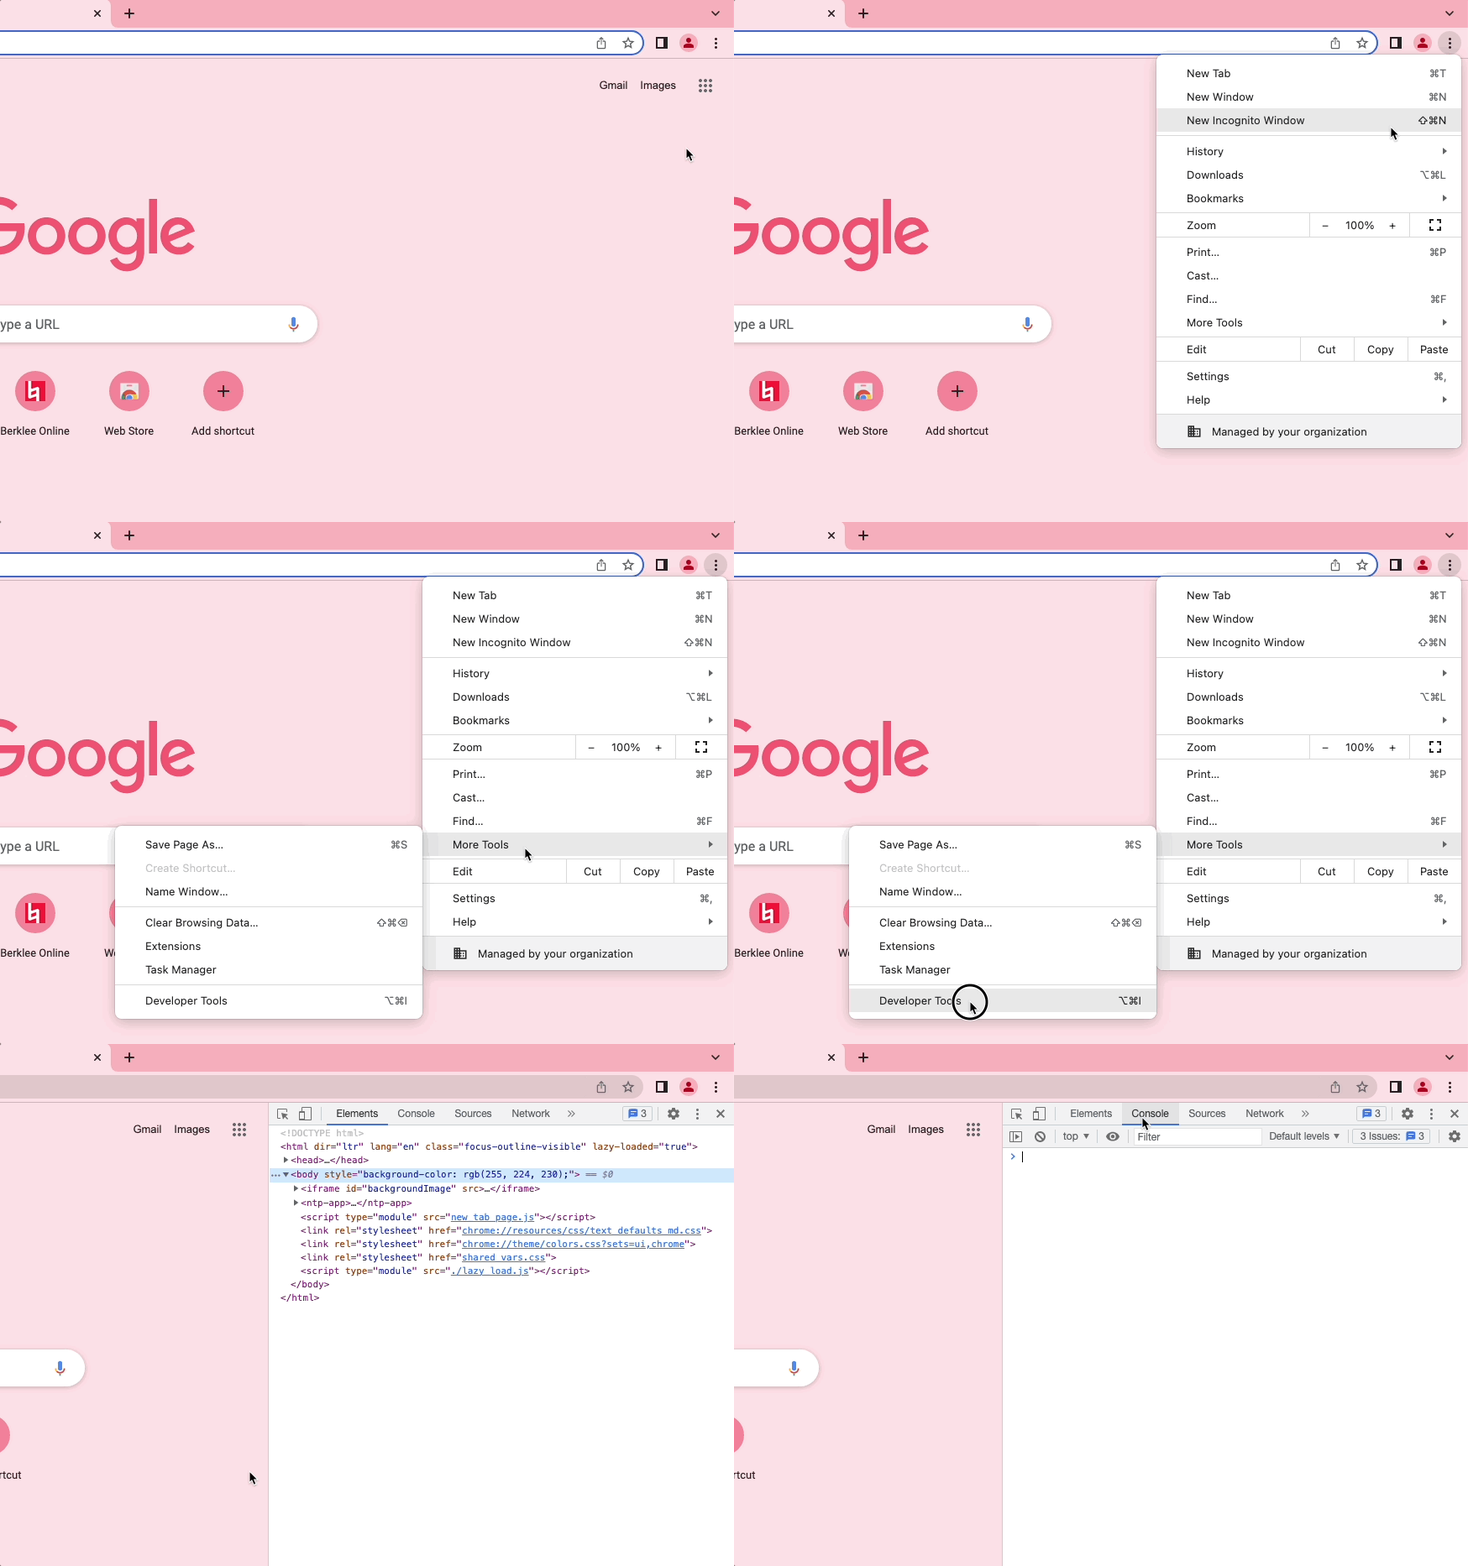
Screen capture showing how to access the JavaScript Console in Chrome
  1. Perform the action you are attempting to troubleshoot. For example, if you are troubleshooting an issue with video playback, play a video within your course.
  2. Take a screenshot of the console (instructions for Mac and Windows).
×
back to top of article

Talk with Support or an Advisor Today!

Connect with us to plan your musical future with Berklee Online.