What do Captain America: The Winter Soldier, Kung Fu Panda: The Dragon Knight, and Gabby’s Dollhouse have in common? Emmy-winning music supervisor Vivian Aguiar-Buff helped shape their sound. In this deep-dive interview, the Music Supervision and Film Scoring instructor reflects on her path from law school dropout to Remote Control Productions, the secrets behind music supervision, and why being part of a creative team means leaving your ego at the door.
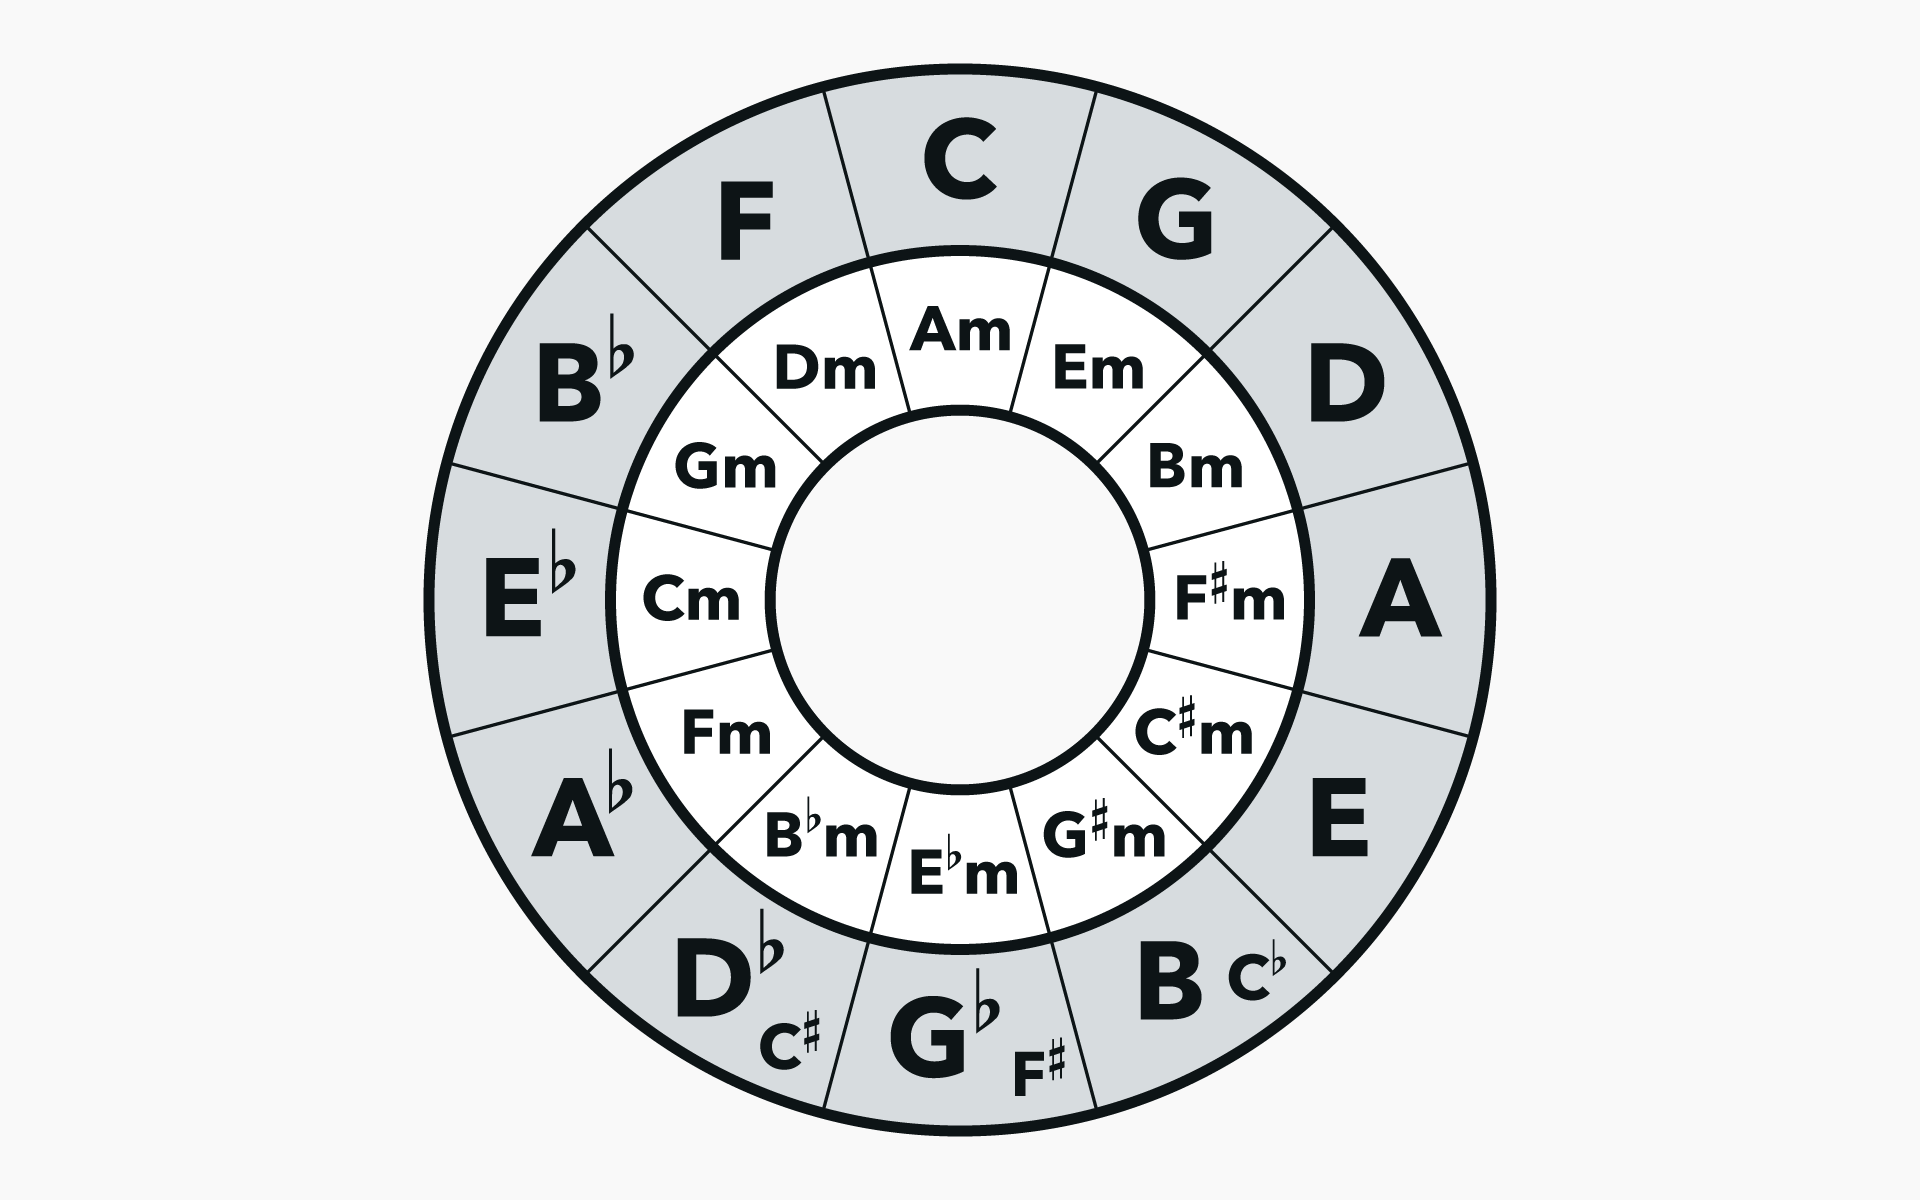
The circle of fifths is arguably the most helpful way of visually organizing Western music theory’s 12 chromatic pitches for learning. This primer, featuring excerpts from Music Application and Theory and Music for Beginners will give you several new tools to commit this concept to memory.
Take an in-depth look at the rise of Hip Hop Culture—from Bronx block parties to global stages—as a powerful expression of Afro-Diasporic identity, resilience, and artistry in this lesson excerpt from Black Creative Expression.
Huey Lewis: Some of his lies are true, including the ones about stowing away on a plane to Europe, playing soccer with Black Sabbath and Ozzy, and being dressed by Phil Lynott of Thin Lizzy. He also touches upon his meteoric rise to fame in the 1980s and his struggles with Ménière’s disease.
The following information on music industry data is excerpted from the Berklee Online graduate course Data Analytics in the Music Business, written by Liv Buli, and currently enrolling.
The end goal of working with data is to reach actionable insights and intelligent recommendations. In other words, we want to be able to use this data and information in a manner that allows us to confidently predict outcomes and take action based on what we think will happen. We want to reach larger audiences while spending less money, market our artists in the most efficient way possible, sell more albums, and rack up more streams. We can use data to get us there, but first we have to access and process that data responsibly.
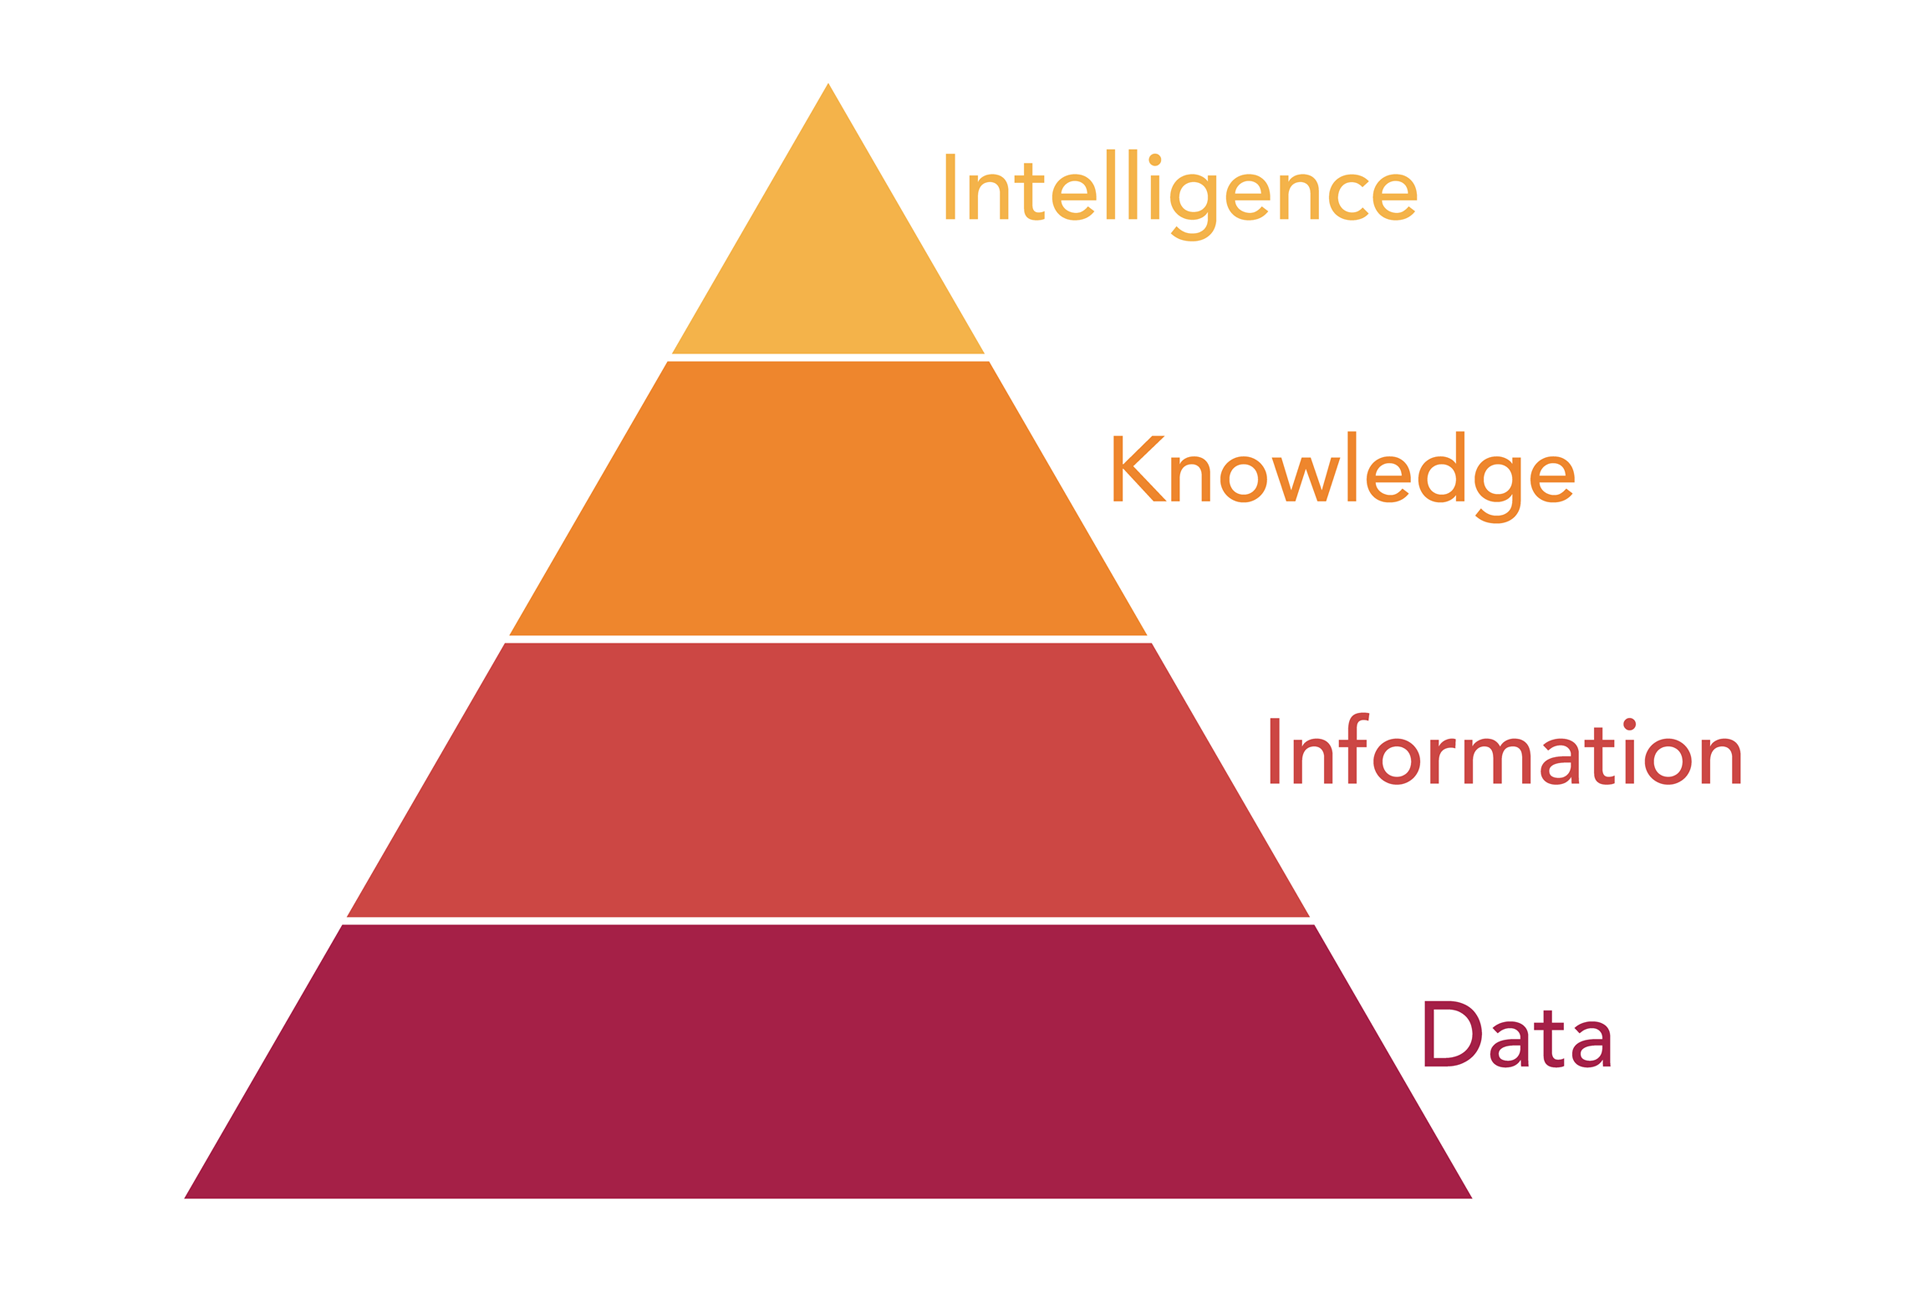
Exactly how we get from unstructured data to actionable intelligence is presented in a simple (though surprisingly complex once you start digging in) chart known as the Data Pyramid. Let’s get into it!
Meet the Data Pyramid
Each layer of the pyramid represents a stage in the analysis or application of data, from the raw data we start with (where we will inevitably spend most of our time), to the actionable insights we can derive once we arrive at the intelligence level. In order to truly understand its value as a framework, let’s take a closer look at each individual layer and its meaning.
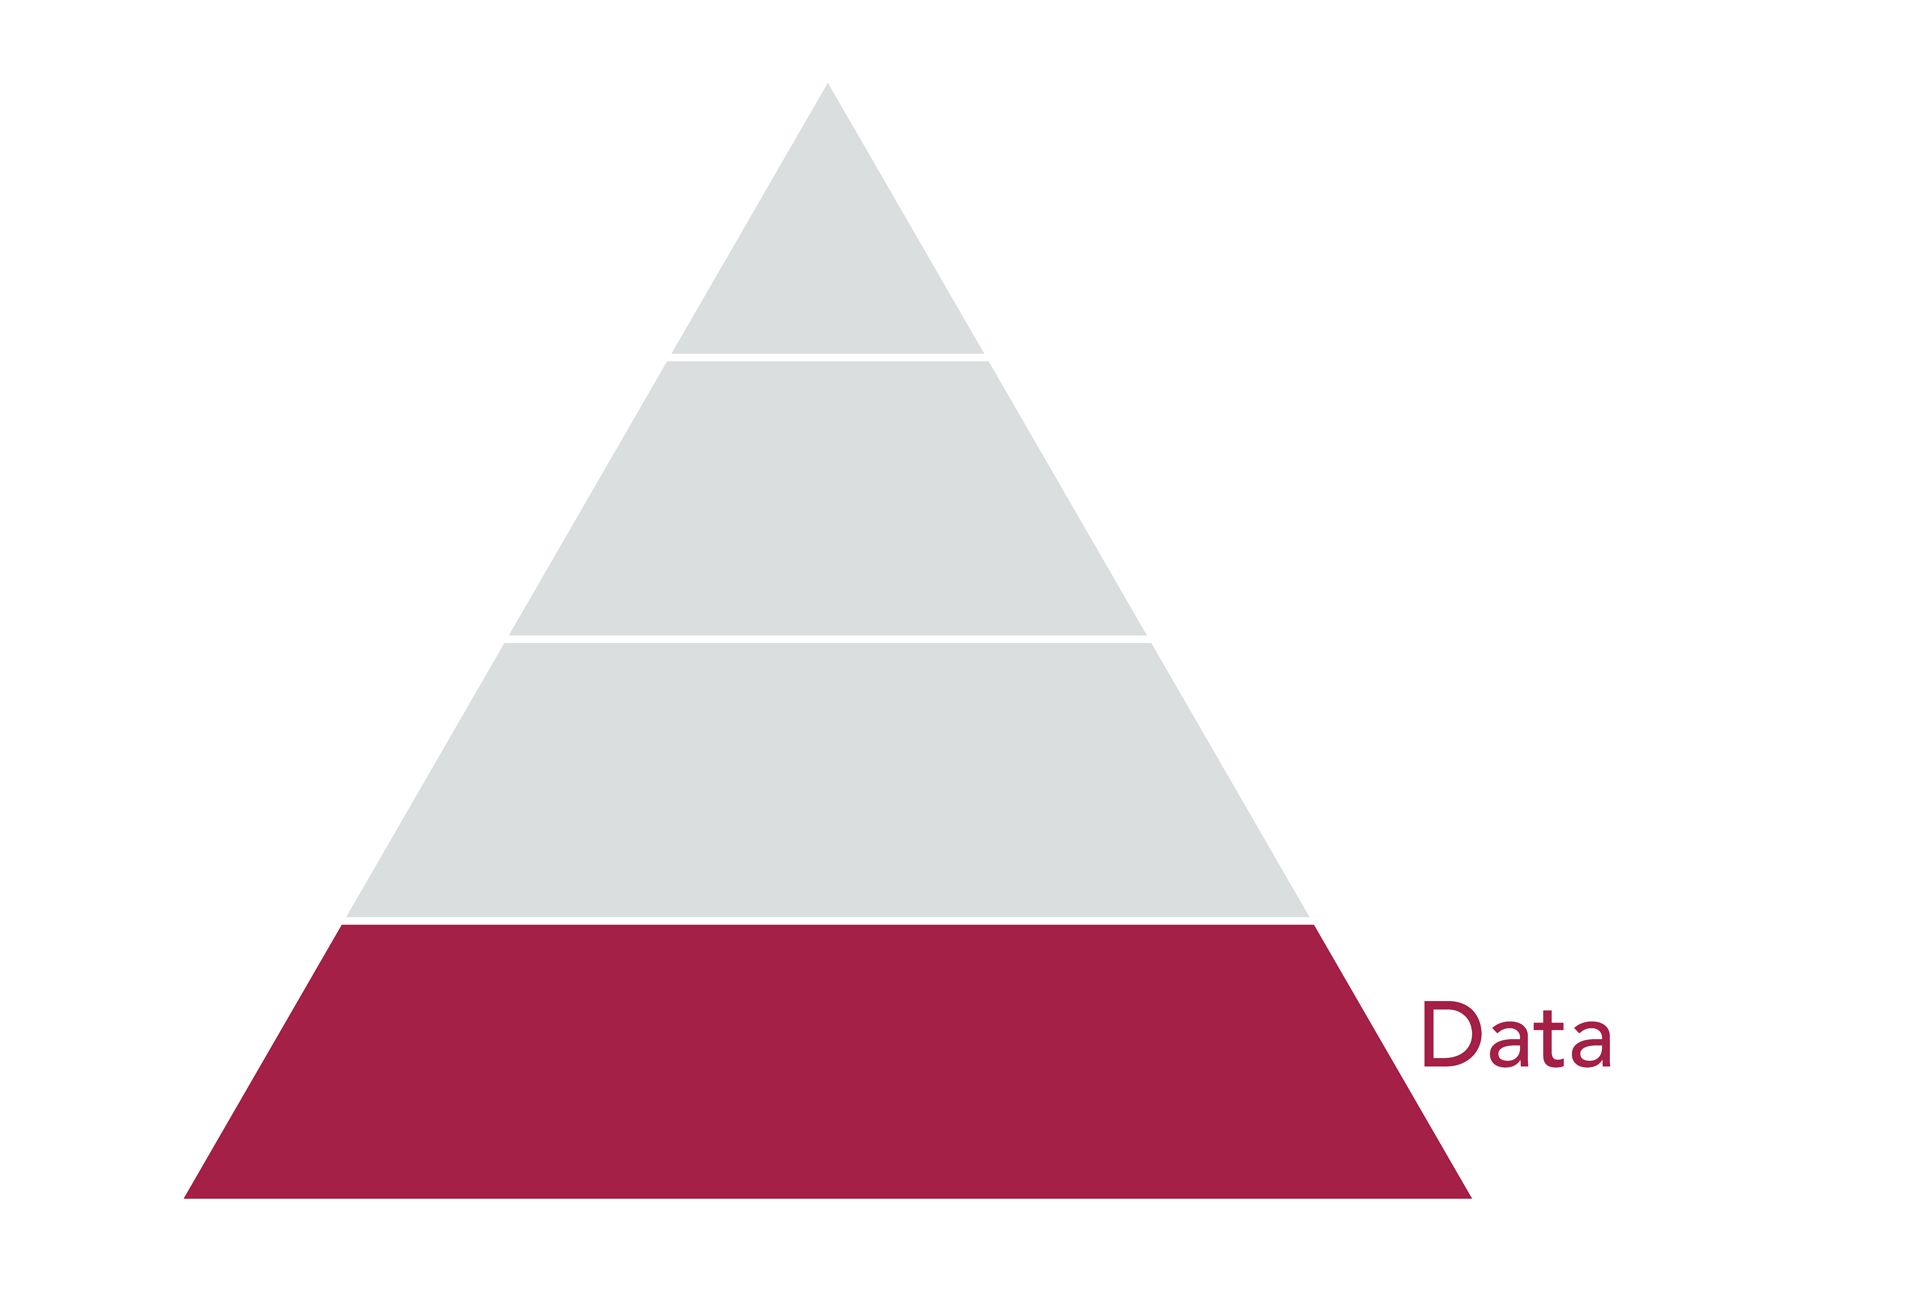
Data Layer
The fundamental layer of the data pyramid is, perhaps unsurprisingly, data. At this point we are talking about how we collect unstructured, raw data points, and how we evolve that collection when DSPs (digital service providers, like Spotify, iTunes, etc.) or social networks become mainstream.
Let’s not forget that MySpace was the most popular (legal) online network for music-sharing when companies like Next Big Sound got their start, that Spotify only just launched in the US in 2012, and that Instagram only really took off as a platform for artists in 2015.
In the music industry, we’re generally talking about the following data:
Artist or album endpoints, so Lady Gaga’s Twitter handle and Facebook username
Time-series data, such as Instagram likes over the past 30 days, etc.
Event data, meaning album release dates or concert dates
Metadata, for instance defining Lady Gaga as a female singer, genre: pop, label: Interscope
At this layer of the data pyramid, there is plenty of work to be done before we can move data up towards deriving information, knowledge, or intelligence. We’ll learn more about the different raw forms of data we might dig up in the next topic.
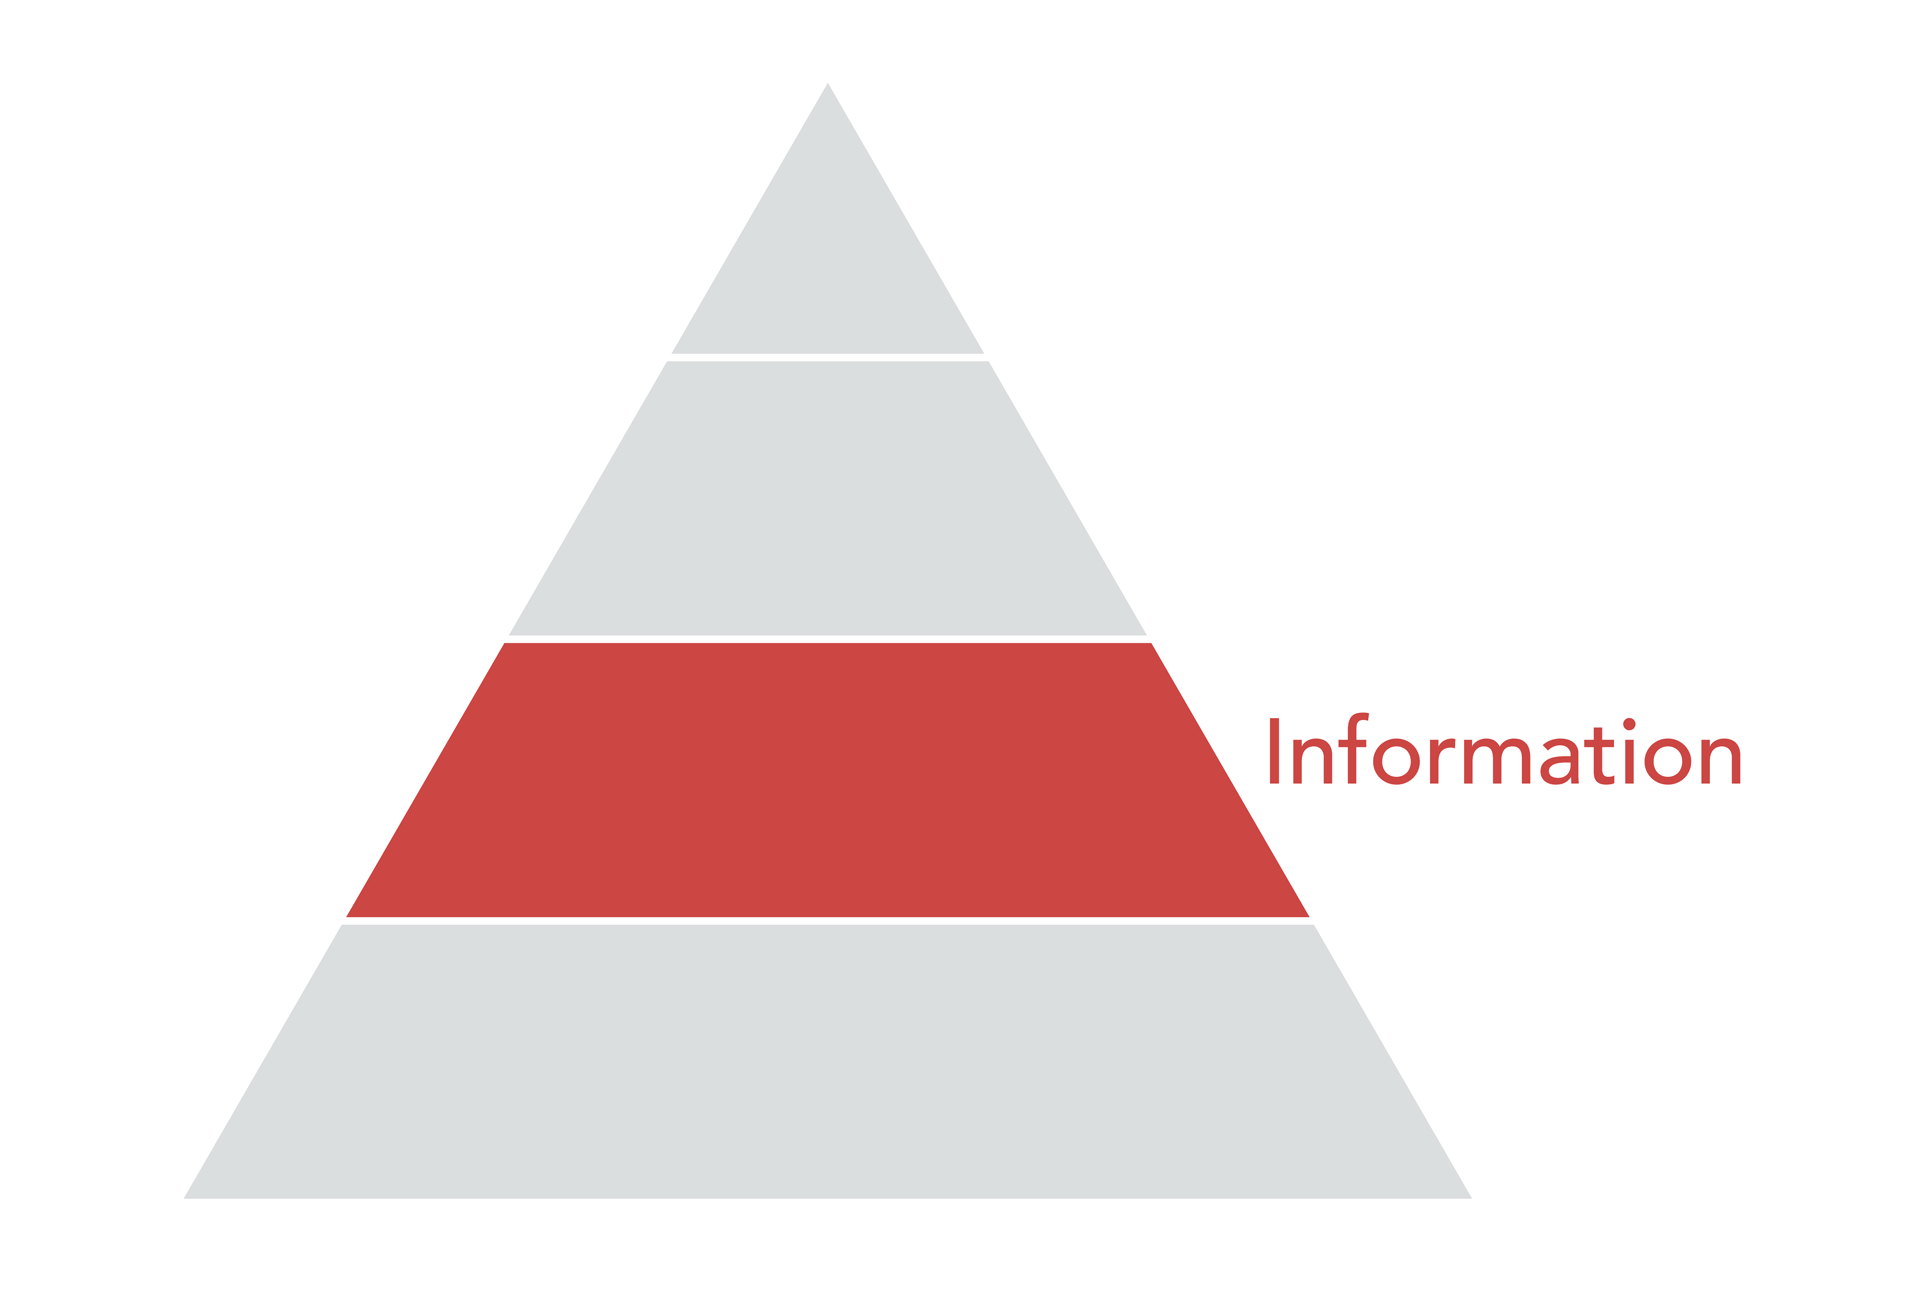
Information Layer
The next level of the pyramid is information. Here we are starting to talk about structuring our data, perhaps visualizing it in some graphical manner or performing cursory analysis in order to begin to understand what data we actually have, and find clues as to what value it might eventually have for our work. In other words: what questions we might be able to answer with it.
Platforms like Next Big Sound, Soundcharts, and others provide web applications that allow us to play around with our data in the information layer. Alternatively, you can upload your raw data to an industry-agnostic reporting tool like Tableau or Plot.ly. It is possible to learn a lot from your data at this level of the pyramid, though making sense of our more structured data will require industry-specific knowledge and context.
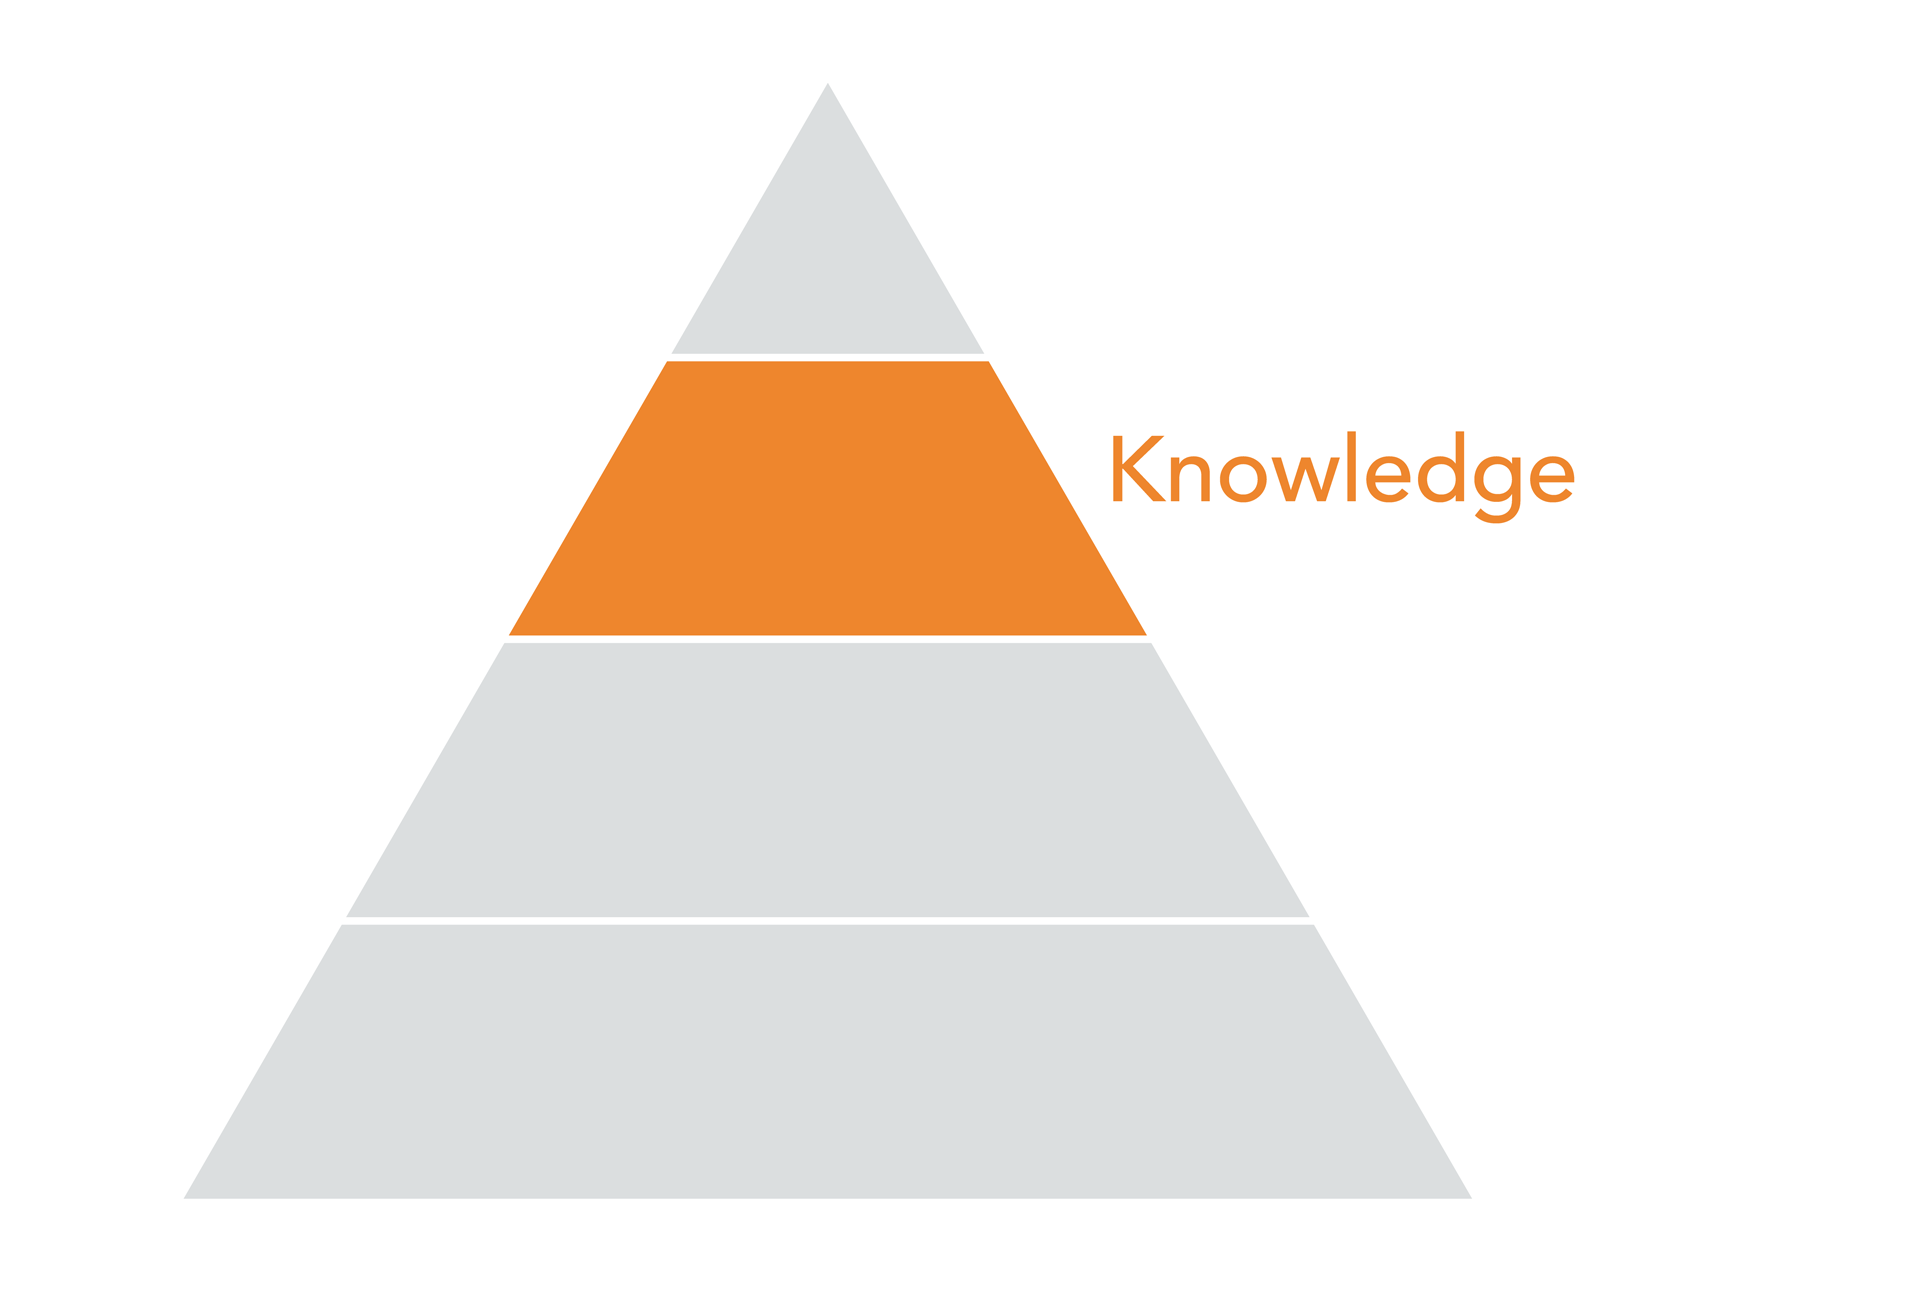
Knowledge Layer
From information we derive knowledge, making our way up the data pyramid. It is the industry-specific context that will help us convert our information into knowledge. For instance: through setting benchmarks and milestones that are unique to the music industry, within specific genres, or tailored to a particular label or artist.
This descriptive, contextual information can be derived from our data, and lends itself to generalized insights about the environment an artist is working within. For instance, we can study the data of thousands of artists that have performed on late-night television shows and understand what impact that tends to have on online engagement, whether it varies from show to show, and what point in the artist development is ideal for a performance of this sort.
During my tenure at Next Big Sound we spent a significant amount of time learning from users what context they would typically apply to their analysis, and aimed to build data-driven benchmarks and valuable groupings such as “artist stages” in order to meet these needs. It doesn’t make sense to compare performance for your indie artist to that of Beyoncé, unless you are looking to demoralize and disappoint.
Keep in mind that this does not mean we can prescribe an action and know exactly what the outcome will be for your artists. We cannot say that if your artist with x number of followers performs on Jimmy Fallon, they are going to sell x number of albums. We can say, however, that artists of this size have, on average, sold x number of albums after performing on Jimmy Fallon. You can use this information to benchmark performance and set expectations against.
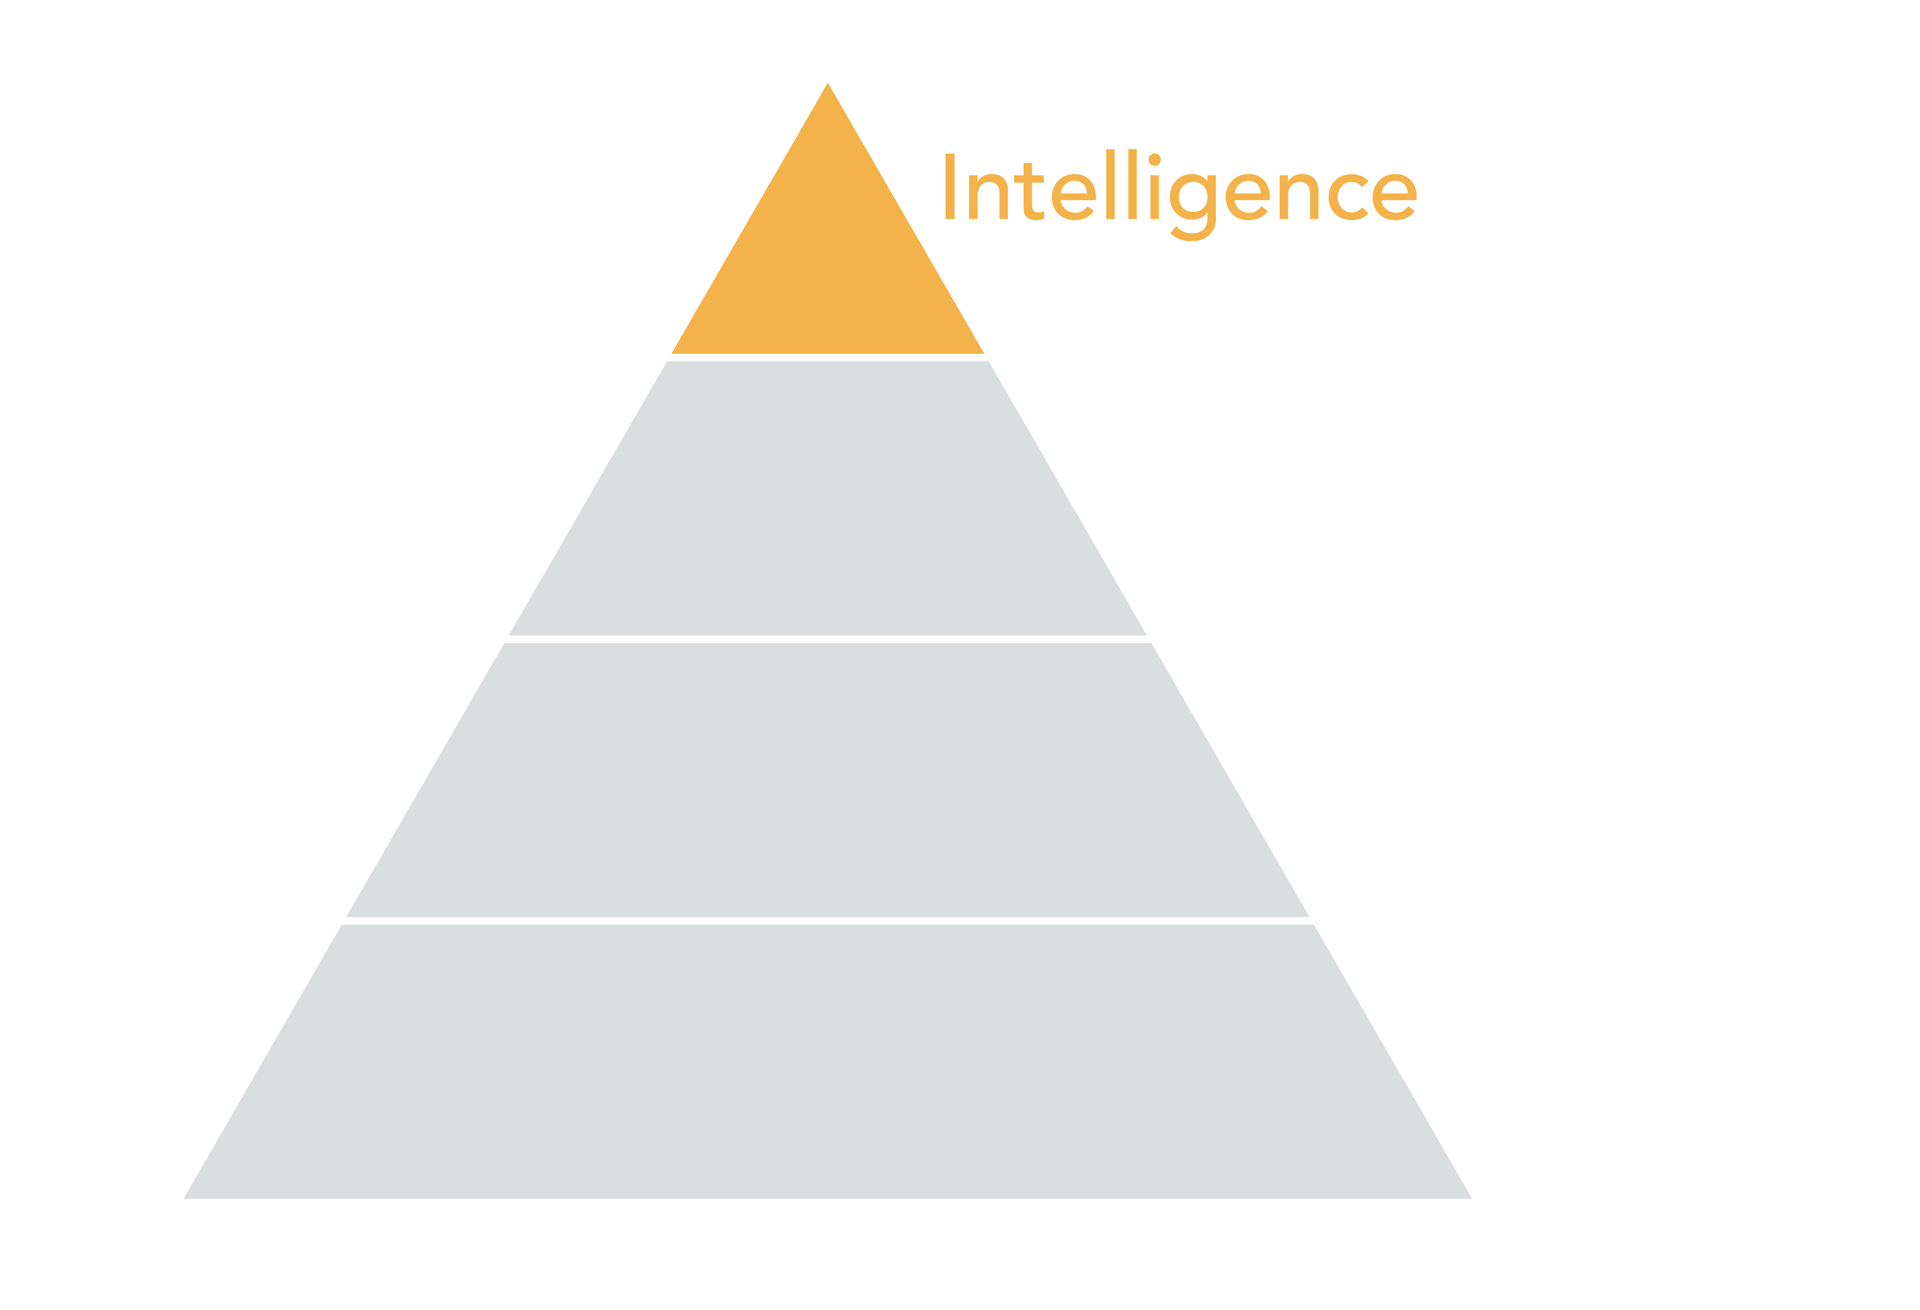
Intelligence Layer
The top tier of the pyramid, intelligence, is relevant when we are able to be more prescriptive with our analysis, but this is also a far riskier endeavor.
The intelligence layer indicates that we are able to predict outcomes and recommend actions with a high level of confidence. This high level of confidence is extremely important as we are talking about prescribing specific actions in business decisions that can be worth millions of dollars, if not more: which artist to sign, when to release music for maximum impact, whether to send an artist on an arena tour. It can be very expensive to make the wrong prediction.
It should almost go without saying that fundamental to all of this is clean and accurate data. You can’t build valuable charts, reasonable benchmarks, or accurate predictions if your data is corrupted or lacking in some way. And believe me, you are about as likely to find a pot of gold at the end of the rainbow as you are to find a clean and consistent raw set of data.
This is why we will spend the majority of our time at the data layer, familiarizing ourselves with the data and its characteristics, thinking about how best to structure this data, and searching for any inconsistencies or inaccuracies that will snowball into bigger problems later. Let’s take a closer look at what that raw data might look like.
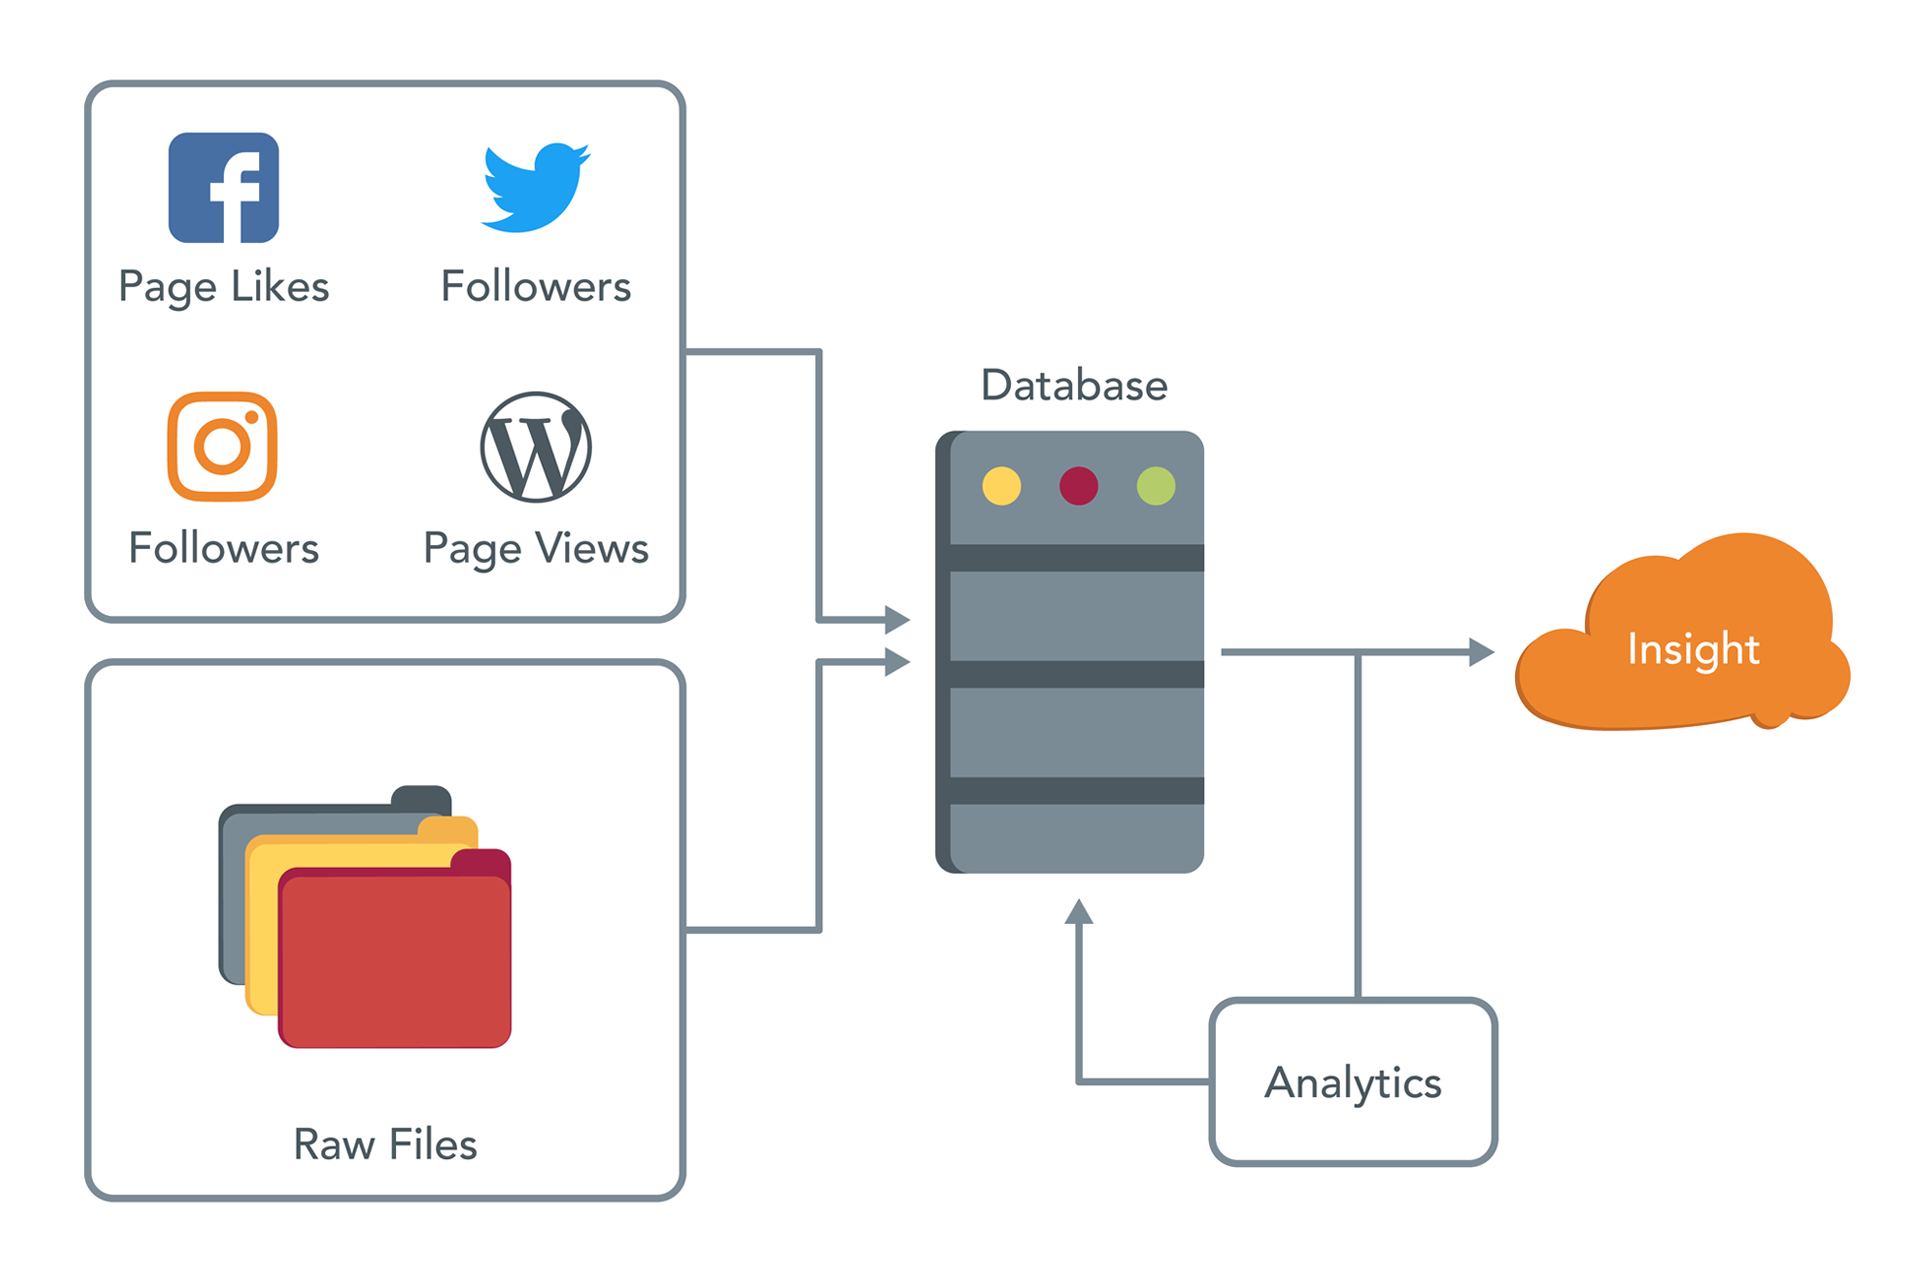
The following is a high-level overview of what it looks like when a platform like Next Big Sound endeavors to collect and process a combination of public (Facebook page likes, Wikipedia page views, etc.) and proprietary (Point of Sale, ticket sales) data, and ultimately deliver insights back to users. The whole process would be fairly straightforward if only the raw files that we import into a database were clean and consistent.
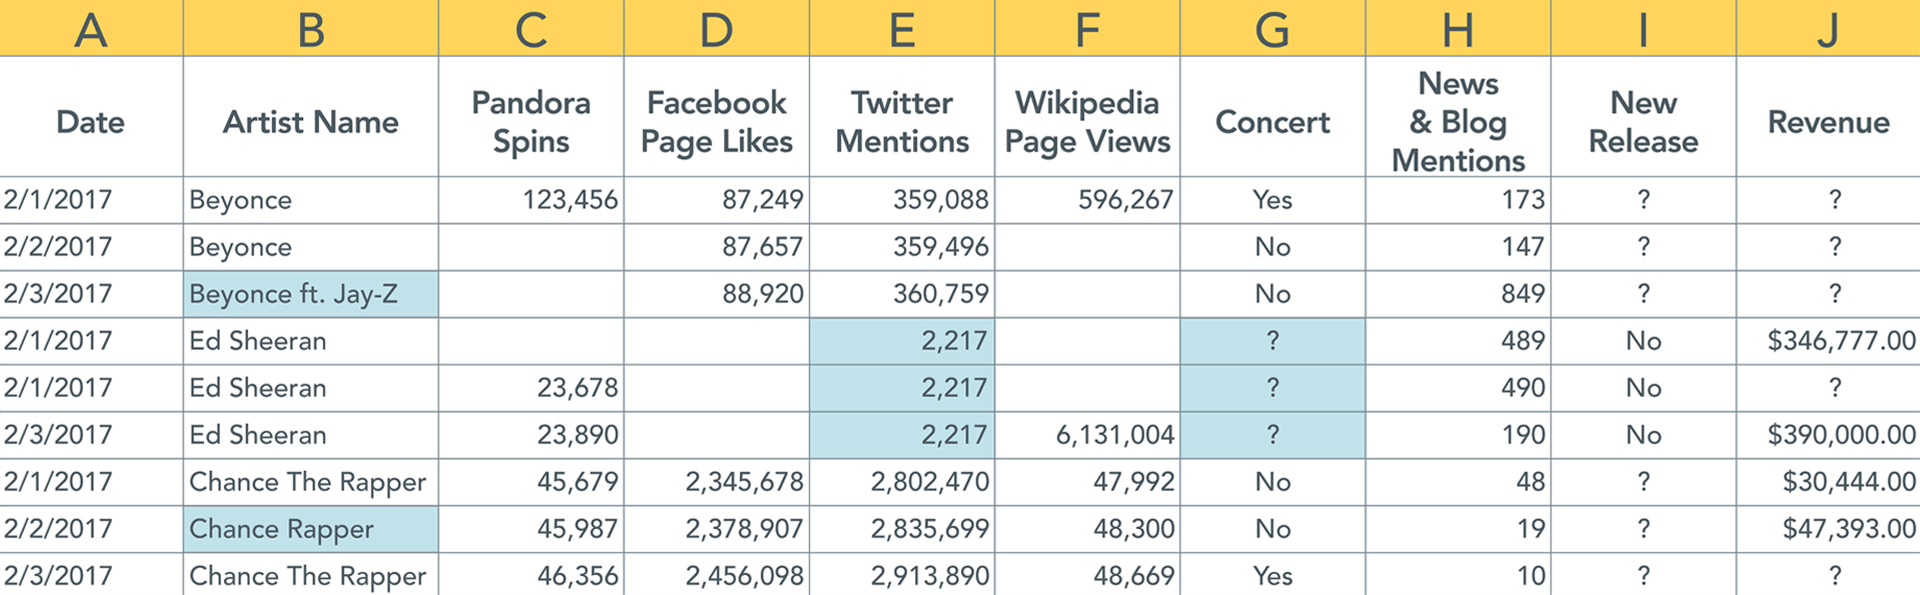
Unfortunately, that’s rarely the case. Let’s look at how we imagine data will be presented:
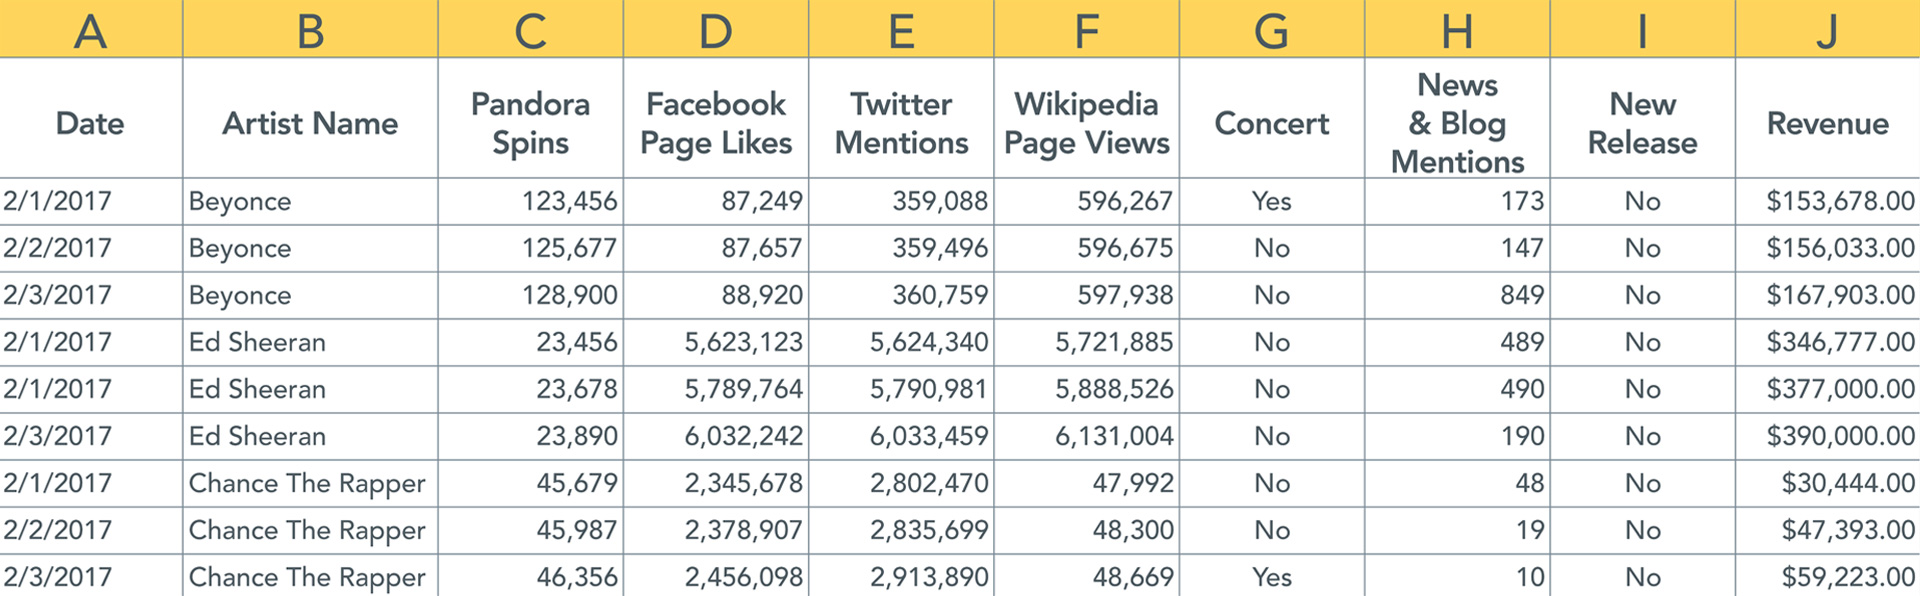
Now let’s see how data is usually presented.
As we learned when reviewing the data pyramid, we know that if we were to go ahead and process data that is rife with inconsistencies and issues, we will ultimately end up delivering insights that are inherently flawed.
Common Issues with Music Industry Data
Some of the common issues we might come across with music industry data include:
Data is simply missing or doesn’t update
Looking at a data set we will often find unpopulated cells. Assuming we are collecting data daily, one reason for this could simply be that not all artists are seeing activity every day.
For instance, a new band playing local shows and just getting their start is not likely to see consistent activity on social media. No activity, no data.
In fact, looking across all artists, the average number of new Facebook page likes is less than one.
Alternatively, did your data indexer break or fail in some manner?
An artist changes their social handle or username
As mentioned earlier, artist and album endpoints are an important data source in the music industry.
What happens when Tyler the Creator changes his Twitter handle from @fucktyler to @tylerthecreator?
If we are hitting the endpoint “twitter.com/fucktyler,” attempting to collect data for Tyler the Creator, we are suddenly unable to collect time-series data for the artist.
Unless the switch is highly publicized, it can take a while to notice and update the artist endpoint, as a result we will be missing data unless we can access a historic record and backfill.
The characteristics of your data can be confusing
Different data is available in different formats and over different periods of time.
Are we looking at deltas or totals? Is the value you are collecting an updated tally of 100 million followers in total, or 200,000 new followers added today?
For instance, Facebook page likes are reported on the Facebook Application Programmable Interface as totals; Facebook PTAT (People Talking About This) is reported as a rolling average of the last seven days.
Are network-wide spikes and dips accurate?
From time to time you might come across massive spikes or dips in data.
These can be network-wide, or for a specific group of artists.
Has the network made some sort of update to how they report data? During the “great Instagram purge” of 2015, the platform shut down a whole slew of spam accounts in a single day, causing poor Justin Bieber to dip below a billion followers (as well as a massive dip in deltas across the majority of artists on the platform).
In fact, the top artists on various networks tend to be “losing” followers on a daily basis as they consistently work to clear out spam accounts across platforms.
Or has a widely publicized industry event like the Grammys caused a legitimate spike in activity?
Did P. Diddy just buy a bunch of Twitter followers? Is TIDAL fudging play counts? Did Kanye delete his account again?
Time-related issues
Have you considered for which timezone you are collecting data, and whether this is consistent across sources? Does your data source update at a certain time of day?
There are several reasons why the solution is not simply to divide the weekly number by seven to get a daily count.
Periodicity is one factor. For instance, Facebook could overall see more activity on Mondays.
Weekly data reporting also makes it more difficult to capture the big events (assuming they happen on a single day) that drive sales and streams for an artist.
It is clear that industry-specific knowledge is extremely valuable in determining the quality and accuracy of your data. Often when these issues crop up, it will be the analyst’s responsibility to uncover the cause and eventual remedy for messy data.